Maps
-> Statistics
Satellite/Aerial Photos
Pictures
Publications
WWW Links
General Information![]()
Maps![]()
-> Statistics![]()
Satellite/Aerial Photos![]()
Pictures![]()
Publications![]()
WWW Links![]()
Click images to enlarge. Please note that some statistics are in German language.
Overview:| Seoul | |||
| Year | Population | % of urban population* | % of total population** |
| 1950 | 1 021 000 | 24.9 | 5.3 |
| 1955 | 1 553 000 | 30.1 | 7.3 |
| 1960 | 2 361 000 | 34.0 | 9.4 |
| 1965 | 3 452 000 | 37.6 | 12.2 |
| 1970 | 5 312 000 | 41.5 | 16.9 |
| 1975 | 6 808 000 | 40.8 | 19.6 |
| 1980 | 8 258 000 | 38.9 | 22.0 |
| 1985 | 9 547 000 | 36.3 | 23.6 |
| 1990 | 10 544 000 | 33.2 | 24.5 |
| 1995 | 10 256 000 | 29.4 | 23.0 |
| 2000 | 9 917 000 | 26.8 | 21.4 |
| 2005 | 9 825 000 | 25.4 | 20.7 |
| 2009 | 9 778 000 | 24.5 | 20.2 |
| 2010 | 9 773 000 | 24.3 | 20.2 |
| 2015 | 9 767 000 | 23.6 | 19.9 |
| 2020 | 9 767 000 | 23.1 | 19.7 |
| 2025 | 9 767 000 | 22.8 | 19.7 |
Source: UN World Urbanization Prospects 2009 *Population residing in agglomeration as percentage of urban population of the country. ** Population resiging in agglomeration as percentage of total population of the country. |
|||
| Seoul | |
| Year | Average annual rate of change % |
| 1950-1955 | 8.38 |
| 1955-1960 | 8.38 |
| 1960-1965 | 7.60 |
| 1965-1970 | 8.62 |
| 1970-1975 | 4.96 |
| 1975-1980 | 3.86 |
| 1980-1985 | 2.90 |
| 1985-1990 | 1.99 |
| 1990-1995 | -0.55 |
| 1995-2000 | -0.67 |
| 2000-2005 | -0.19 |
| 2005-2010 | -0.11 |
| 2010-2015 | -0.01 |
| 2015-2020 | 0.00 |
| 2020-2025 | 0.00 |
| Source: UN World Urbanization Prospects 2009 | |
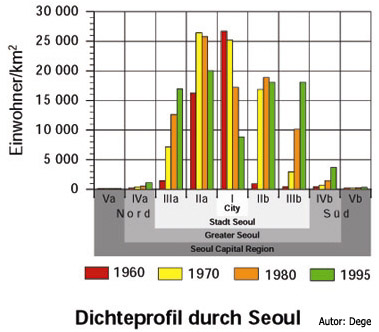 Dichteprofil |
|
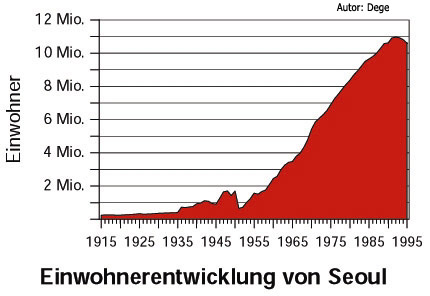 Einwohnerentwicklung | |
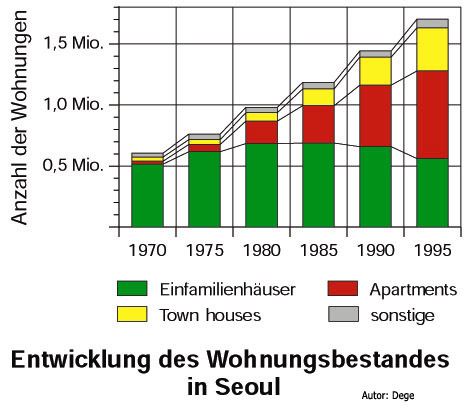 Entwicklung des Wohnungsbestandes |
|